Module 1: The Data Foundation. The Architecture of SaaS Data
If you ask a CEO, a Sales Director, and a Lead Engineer how many active customers their B2B SaaS company has, you will likely get three completely different numbers. The CEO looks at the financial dashboard, the Sales Director looks at the CRM, and the Engineer looks at the active rows in the production database. This discrepancy is the silent killer of modern software companies.
In the world of B2B SaaS, data is not just a byproduct of software; it is the absolute foundation of Revenue Operations (RevOps). To scale a company from $1M to $10M in Annual Recurring Revenue (ARR), you cannot rely on gut feelings or fragmented spreadsheets. You must master SaaS data architecture.
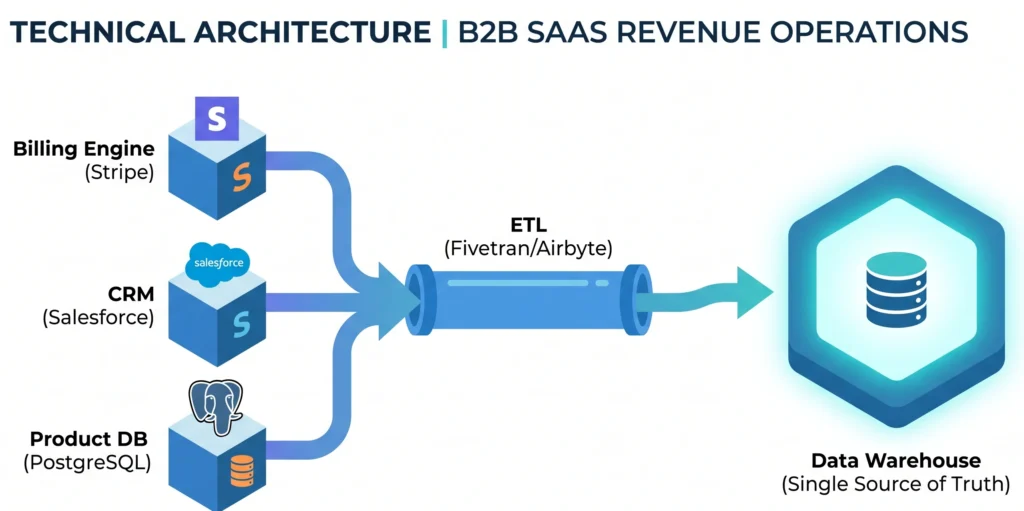
In this comprehensive lesson, we will dissect the B2B data ecosystem. We will answer the fundamental question: “Where does the money actually live?” By examining the three pillars of SaaS architecture—the Billing Engine, the CRM, and the Product Database—we will uncover how they function under the hood, why they naturally create data silos, and how data engineers architect solutions to unify them into a Single Source of Truth (SSOT).
- The biggest silent killer of SaaS growth is fragmented data silos between Billing (Stripe), CRM (Salesforce), and your Product DB.
- Querying transactional (OLTP) databases for historical analytics will crash your production systems.
- To scale past $1M ARR, you must implement an ETL pipeline to centralize data into a Single Source of Truth (SSOT) Data Warehouse.
1. The Illusion of the Single Dashboard
When a founder starts a SaaS company, the architecture is simple. A user signs up, pays via a credit card, and uses the tool. All data seems to exist in one place. However, as the company enters the B2B space and hires a sales team, this monolith breaks apart.
Enterprise clients do not just swipe credit cards. They require demos, contract negotiations, invoicing, and custom onboarding. To handle this complexity, the company adopts specialized third-party systems. Suddenly, the customer’s journey is scattered across a highly fragmented B2B data ecosystem.
To understand how to analyze this business, we must first understand the architectural triad of SaaS data.
2. Pillar 1: The Billing Engine (Stripe / Chargebee)
If you want to know where the actual, realized money lives, you look at the Billing Engine. Platforms like Stripe or Chargebee are the financial heartbeat of a SaaS company. They handle the complex mathematics of recurring revenue, prorations, failed payments, and international taxes.
From a data engineering perspective, Stripe billing data is highly structured and transactional. It operates on a strict schema defined by specific API objects:
Step 1: The Customer Object (cus_…)
This represents the entity paying the bill. It contains the email, billing address, and linked payment methods. However, it rarely contains deep firmographic data (like the company’s employee count or industry).
Step 2: The Subscription Object (sub_…)
This is the core of SaaS. It links a Customer to a specific Pricing Plan. It dictates the billing cycle (monthly or annually) and tracks the status (e.g., active, past_due, canceled).
Step 3: Invoices and Events (in_… and evt_…)
Every time a subscription renews, an Invoice is generated. Stripe also emits chronological Events (webhooks) for every single action, creating a perfect, immutable ledger of financial history.
The Billing Engine is the ultimate source of truth for critical financial metrics: MRR (Monthly Recurring Revenue), ARR (Annual Recurring Revenue), and Net Revenue Retention (NRR). If a customer’s credit card fails and the subscription is marked as canceled in Stripe, they are officially churned, regardless of what the sales team thinks.
3. Pillar 2: The CRM System (HubSpot / Salesforce)
Before a prospect ever signs a contract or generates reliable Stripe billing data, they interact with your marketing and sales teams. This early lifecycle stage is where platforms like HubSpot or Salesforce dominate. But what exactly are they? At their core, Customer Relationship Management (CRM) systems act as the operational brain of your Go-To-Market (GTM) strategy. They are specialized databases designed to track every human interaction—from a website visitor downloading a technical whitepaper to an enterprise executive negotiating a complex, multi-year contract.
In a mature B2B data ecosystem, the CRM is the primary interface for your sales representatives. However, out of the box, a standalone CRM is essentially just a glorified digital address book. The real business value is unlocked through proper Salesforce CRM integration. By connecting your CRM to marketing automation tools, email clients, and eventually your central data warehouse, Revenue Operations teams can accurately forecast future cash flows based on current pipeline velocity.
This is precisely why mastering SaaS data architecture is so critical. Unlike the rigid, automated nature of financial ledgers, CRM data is highly mutable and relies heavily on optimistic human input (e.g., a sales rep manually moving a deal to the “Proposal” stage). If your sales team is closing deals in Salesforce, but that information is not perfectly synchronized with the Product DB to automatically trigger new user account provisioning, your customer onboarding experience will break before it even begins. The CRM tells you the “who” and the “why” behind the revenue, making it the vital bridge between marketing efforts and actual financial realization.
To understand how this data is structured under the hood, we must look at the core objects that make up a CRM’s architecture:
Step 1: Leads and Contacts
These represent human beings. A Lead is an unqualified prospect, while a Contact is an individual associated with a qualified company. They contain phone numbers, LinkedIn profiles, and engagement history.
Step 2: Accounts
This represents the B2B Company itself. One Account can have dozens of Contacts. This is where firmographic data (industry, revenue, headquarters) lives.
Step 3: Opportunities (The Pipeline)
This represents a potential deal. It has a Stage (e.g., Discovery, Proposal, Closed Won) and an Estimated Value. When an Opportunity is marked as Closed Won, the sales rep gets a commission.
Here lies the biggest architectural danger in SaaS: The CRM operates on optimism and manual updates, while the Billing Engine operates on cold, hard bank transactions. If the systems are not integrated, a sales rep might mark a deal as “Closed Won” in Salesforce, but if the client’s wire transfer fails in Stripe, your CRM data is officially hallucinating revenue.
4. Pillar 3: The Product Database (PostgreSQL / MongoDB)
We know who is paying (Stripe) and who we are selling to (Salesforce). But where does the actual value live? It lives in your proprietary Product DB. This is the PostgreSQL, MySQL, or MongoDB instance that actually powers your software.
This database tracks the reality of user behavior. It stores user credentials, organizational hierarchies (Workspaces/Tenants), and the exact features they are utilizing.
To understand the health of a B2B SaaS, data analysts look at product activity logs to calculate the “Time to Value” and identify “Zombie Customers”. A Zombie Customer is an enterprise client who is paying $5,000 a month in Stripe, has a beautiful “Closed Won” record in Salesforce, but has exactly zero active users in the Product DB over the last 90 days.
Without product data, your business is blind. You will be completely blindsided when that Zombie Customer suddenly cancels their subscription at renewal time. Usage data is the only reliable leading indicator of financial churn.
5. The Architectural Challenge: Overcoming Data Silos & Fundamental Theory
The fundamental problem in SaaS data architecture is that these three pillars do not naturally share a common key, nor are they designed for heavy analytical queries. To truly understand this bottleneck, we must look at the fundamental theory of database design: the difference between OLTP and OLAP systems.
Your Stripe billing data, your Salesforce CRM integration, and your Product DB are all engineered as Online Transaction Processing (OLTP) systems. They are optimized for rapid, isolated, single-row updates—like instantly processing a credit card payment or updating a lead’s phone number. However, Revenue Operations require macroscopic analysis, which relies on Online Analytical Processing (OLAP). When you attempt to run complex historical analytics directly on an OLTP database, you risk locking tables and bringing down the entire production application.
Furthermore, because Stripe identifies a customer by a cus_123 ID, Salesforce uses an Account ID 001xx000, and your PostgreSQL database uses a UUID like a1b2c3d4, the data is completely siloed. According to fundamental research by Gartner, poor data quality and fragmented architectures cost organizations an average of $12.9 million annually. This proves that a unified B2B data ecosystem is not just a technical luxury; it is a critical financial survival mechanism.
If you try to query this fragmented data in real-time across production APIs, you will encounter catastrophic performance issues. Fetching 10,000 records from the Stripe API, filtering them, and then matching them against a live PostgreSQL database via nested loops results in an algorithmic time complexity of O(N * M). Your application will simply crash under the load.
Time Complexity = O(Nstripe × Mproduct)
If you want to dive deeper into how establishing a robust structural foundation prevents these massive financial leaks, check out our comprehensive guide on how to scale your B2B Revenue Operations from scratch. Bridging this gap between transactional databases and analytical engines is the defining challenge for any modern data team.
6. The Modern Solution: The Data Warehouse (ETL)
To solve this, Data Engineers utilize the ETL pattern (Extract, Transform, Load) to build a Single Source of Truth (SSOT). Instead of querying the APIs directly, they use tools like Fivetran or Airbyte to asynchronously copy data from Stripe, Salesforce, and the Product DB every few hours.
This raw data is dumped into a highly scalable, columnar Data Warehouse like Snowflake, Google BigQuery, or Amazon Redshift. Once the data is centralized in the warehouse, analytics tools (like dbt) are used to transform and map the IDs together into a unified “Customer 360” table.
Because columnar databases are optimized for massive analytical aggregations rather than single-row transactions, the space complexity and query execution times are drastically reduced. You can now join millions of rows across billing, sales, and product usage in milliseconds.
7. Practice: Unifying Data with SQL
Want to put this theory into practice? Below is a production-ready SQL query designed to be run in a Data Warehouse (like Snowflake or BigQuery). It joins financial records with product usage logs to instantly identify “Zombie Customers” who are paying but not using the tool.
Let’s look at how a Data Analyst writes SQL inside a Data Warehouse to find our “Zombie Customers”—those who are paying but not using the product. We will join our centralized Stripe data with our Product usage data.
-- This SQL query identifies B2B accounts at high risk of churn.
-- It joins financial data (Stripe) with product activity data.

WITH ActiveSubscriptions AS (
    -- Step 1: Get all currently paying customers from Stripe
    SELECT
        customer_id,
        subscription_status,
        mrr_amount
    FROM stripe.subscriptions
    WHERE subscription_status = 'active'
),

ProductUsage AS (
    -- Step 2: Aggregate user logins over the last 30 days from the Product DB
    SELECT
        tenant_id, -- The internal company ID in our product
        COUNT(login_event_id) AS logins_last_30_days
    FROM product_db.user_activity_logs
    WHERE event_date >= CURRENT_DATE - INTERVAL '30 days'
    GROUP BY tenant_id
)

-- Step 3: Join the tables using a pre-defined mapping table
SELECT
    map.company_name,
    sub.mrr_amount,
    COALESCE(usage.logins_last_30_days, 0) AS recent_logins,
    CASE
        WHEN COALESCE(usage.logins_last_30_days, 0) = 0 THEN 'High Churn Risk (Zombie)'
        WHEN usage.logins_last_30_days < 10 THEN 'Medium Risk (Low Adoption)'
        ELSE 'Healthy'
    END AS account_health_score
FROM mapping.company_ids map
JOIN ActiveSubscriptions sub
    ON map.stripe_customer_id = sub.customer_id
LEFT JOIN ProductUsage usage
    ON map.internal_tenant_id = usage.tenant_id
ORDER BY sub.mrr_amount DESC;
This query is the essence of Revenue Operations. By using a LEFT JOIN, we ensure that we see all paying customers, even if they have absolutely zero records in the product activity logs. The resulting dashboard immediately tells the Customer Success team exactly which high-value accounts they need to call today to prevent a financial loss next month.
8. Conclusion: The Foundation of Scale
Data in a B2B SaaS company is inherently messy. It is split between the cold financial reality of the Billing Engine, the human-driven optimism of the CRM, and the raw behavioral truth of the Product Database.
Mastering SaaS data architecture means accepting that the money does not live in just one place. Revenue is a lifecycle. It begins as a Lead in Salesforce, converts into an active MRR metric in Stripe, and is sustained by continuous value delivery tracked in the PostgreSQL database.
As you progress through this course, you will no longer look at software as isolated tools. You will see them as interconnected nodes in a massive B2B data ecosystem. In our next lesson, we will dive deeper into the mathematics of MRR, ARR, and why calculating SaaS metrics is far more complicated than simple addition.